At Remedly, our product evolution is driven by our clients—real feedback, real use cases, real needs. One request we heard again and again was simple:
“We need a clearer way to measure provider performance and understand what treatments actually drive revenue.”
This wasn’t just about numbers—it was about empowering practices to make smarter decisions:
- Which of our treatments produced the highest revenue?
- Which of our providers are delivering more treatments?
- Which location generates the most revenue?
- How has revenue changed year over year? Quarter over quarter?
The result is the new Provider Performance & Revenue Breakdown report in Advanced Analytics. Developed hand-in-hand with our clients, this report brings clarity to complex data—so you can lead with insight, not guesswork.
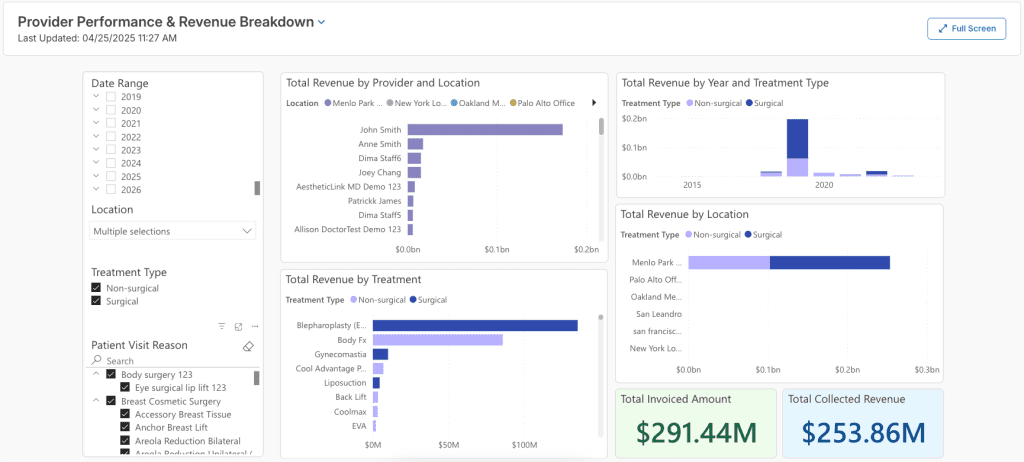
What’s In the New Report
Your clinic's performance from a financial perspective is presented in the new report in Advanced Analytics in a variety of ways.
You can now filter and investigate data on:
Treatment Type
Distinguish between surgical and non-surgical services.
Visit Reason
Segment data by the reasons patients come in—from consultations to follow-ups to specific procedures.
Location
Compare revenue across clinics to uncover operational gaps or marketing opportunities.
Time Period
Analyze trends by month, quarter, or year—ideal for tracking growth and planning ahead.
The dashboard is interactive as well, so if you change any filter it updates your data in an instant—no re-loading, no waiting. And any chart and table can be exported as CSV so you can share the insight or upload it to other tools like CRMs or email platforms.